-1.png)
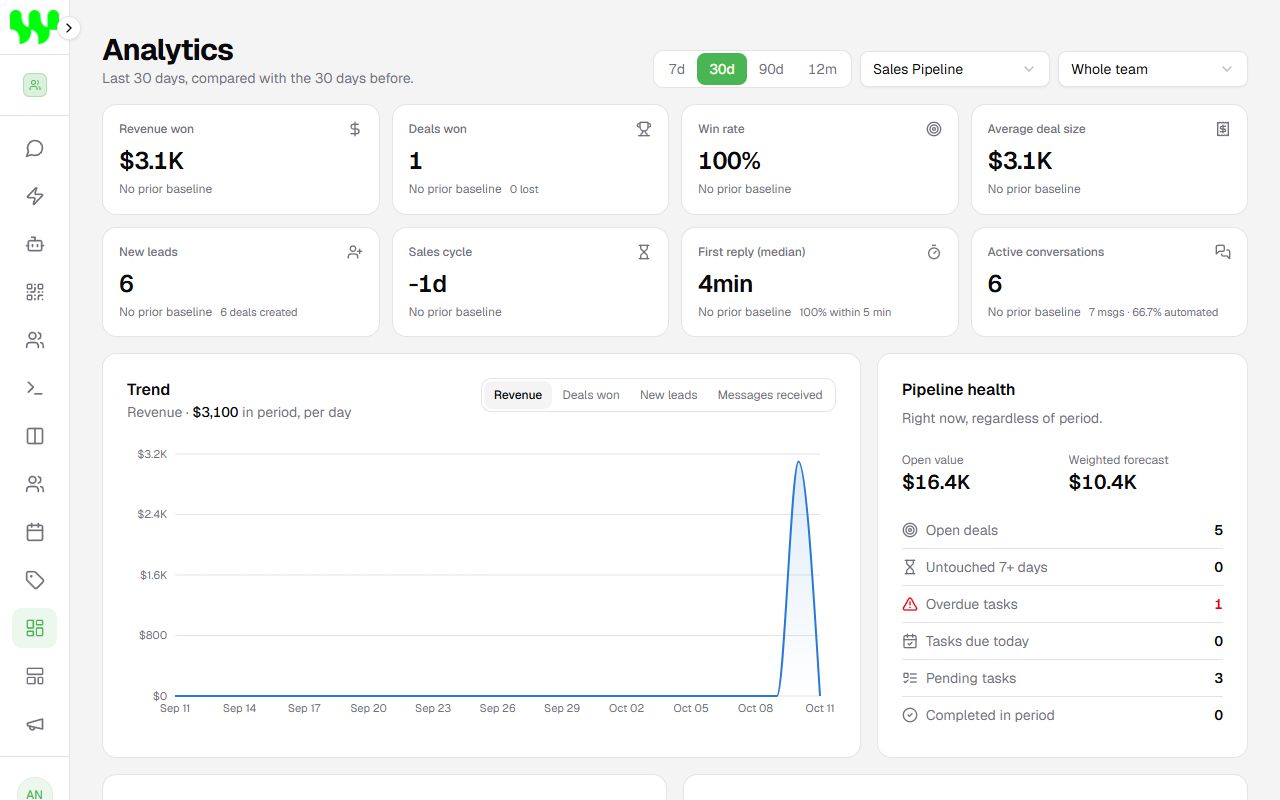
The Dashboard shows how your sales and customer service are doing in one place. Every number compares the chosen period with the previous period of the same length (e.g. the last 30 days against the 30 days before that).
Filters
In the top right corner:
- Period: 7 days, 30 days, 90 days or 12 months.
- Pipeline: one specific pipeline or all.
- Owner: one team member or the whole team.
Main indicators
| Indicator | What it means |
|---|---|
| Revenue won | Sum of deals marked as won in the period. |
| Deals won | Number of won deals (and how many were lost). |
| Win rate | Of the closed deals, how many were won. |
| Average deal size | Average value of each sale. |
| New leads | New contacts in the period and how many deals were created. |
| Sales cycle | Average time between creating and winning a deal. |
| First reply (median) | How long the customer usually waits for the first reply. Also shows how many were answered within 5 minutes. |
| Active conversations | Chats with messages in the period, how many messages arrived and how many were answered automatically. |
Green arrows mean improvement over the previous period; red ones, a decline. "No prior baseline" appears when there is no data to compare.
Charts and panels
- Trend: chart of revenue, deals won, new leads or messages received over the period.
- Pipeline health: open value, probability-weighted forecast, deals untouched for 7+ days and overdue, today's and pending tasks. It shows the situation right now, regardless of the period.
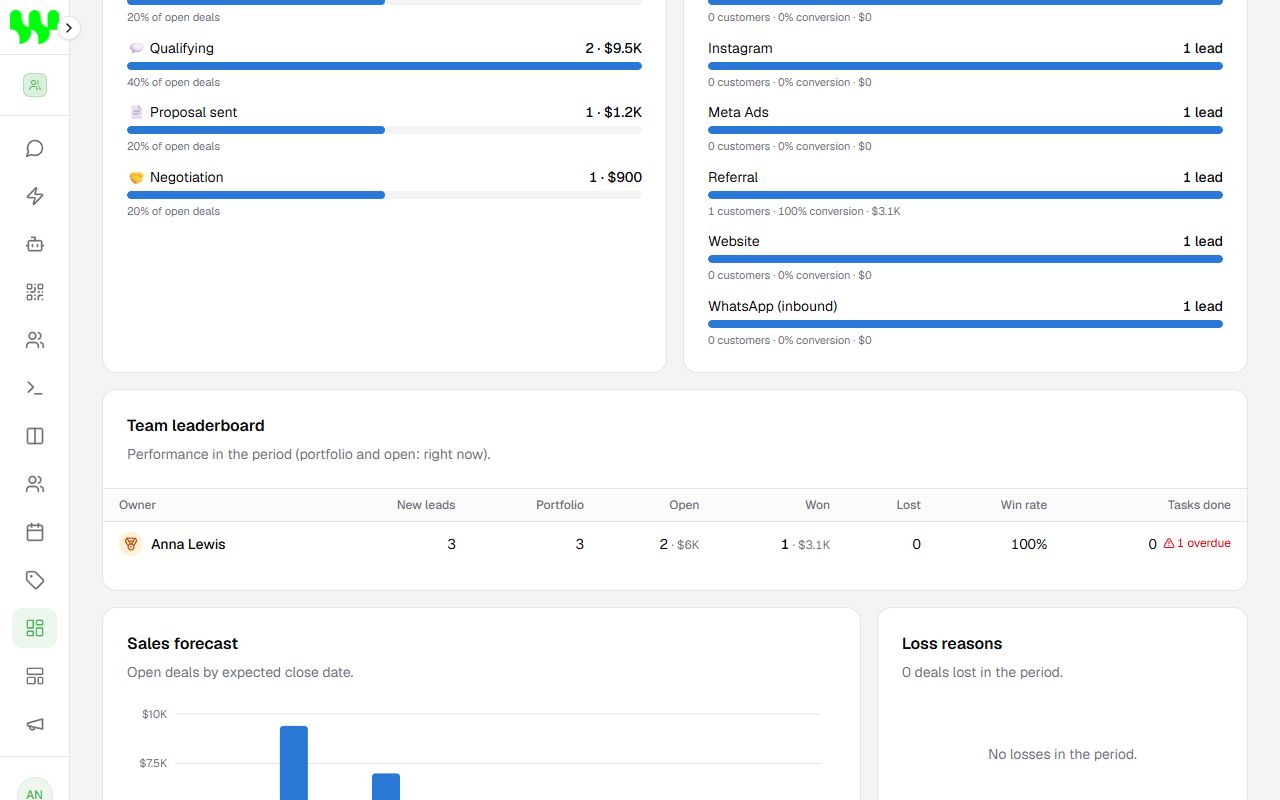
- Sales funnel: how many open deals and how much value there is in each stage.
- Lead sources: where leads came from (ads, Instagram, website...) and how many became customers.
- Team leaderboard: per person — new leads, portfolio, open, won, lost, win rate and tasks done.
- Peak hours: heat map of the days and hours with the most incoming messages. Useful to plan your team's shifts.
- Base temperature: how many contacts are hot, warm and cold.
- Loss reasons: why deals are being lost.
- Sales forecast: open deals organized by expected close date.
- Service: messages received and sent, how much was answered by AI/automation and how much by humans, and the percentage of customers answered within 5 minutes.
To get accurate numbers
Reports depend on how you use the CRM: mark deals as won/lost (with a reason) and fill in contacts' values, source and temperature. The more complete, the more useful the reports.
Permission
The Dashboard is shown to people with the Manage Team Settings permission.